Spring 2022
The titanic dataset contains data of the 891 passengers and we have to predicted if they survived or not based on the information we have available about the passengers and the outcome after the sinking of the ship. The predictor variable is 'Survived', also has numeric variables, like ids, ages of the passengers, etc. followed by categorical variables like class of the ticket, and strings like name. I performed EDA, Data cleaning,Model selection process to draw conclusion that Support Vector Classifier performed best with accuracy of 82%
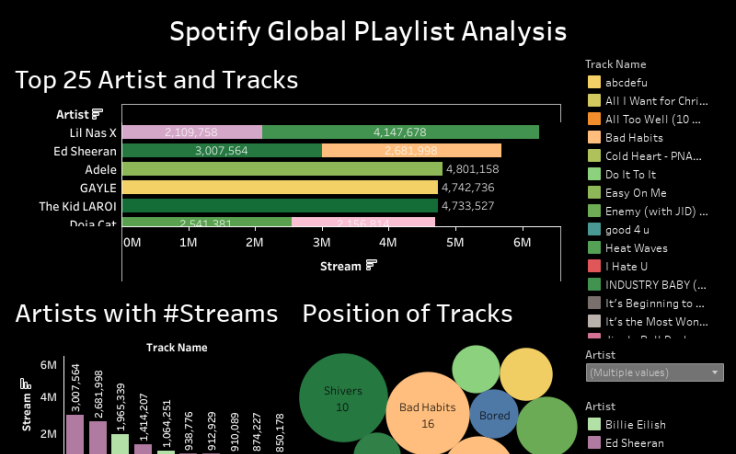
This is my Tableau public portfolio where I built interactive visualizations for different topics. This is a spotify playlist analysis visulaization showing the top 25 artists based on tracks and streaming. The next part of the dashboard shows artists with streams and position of tracks.
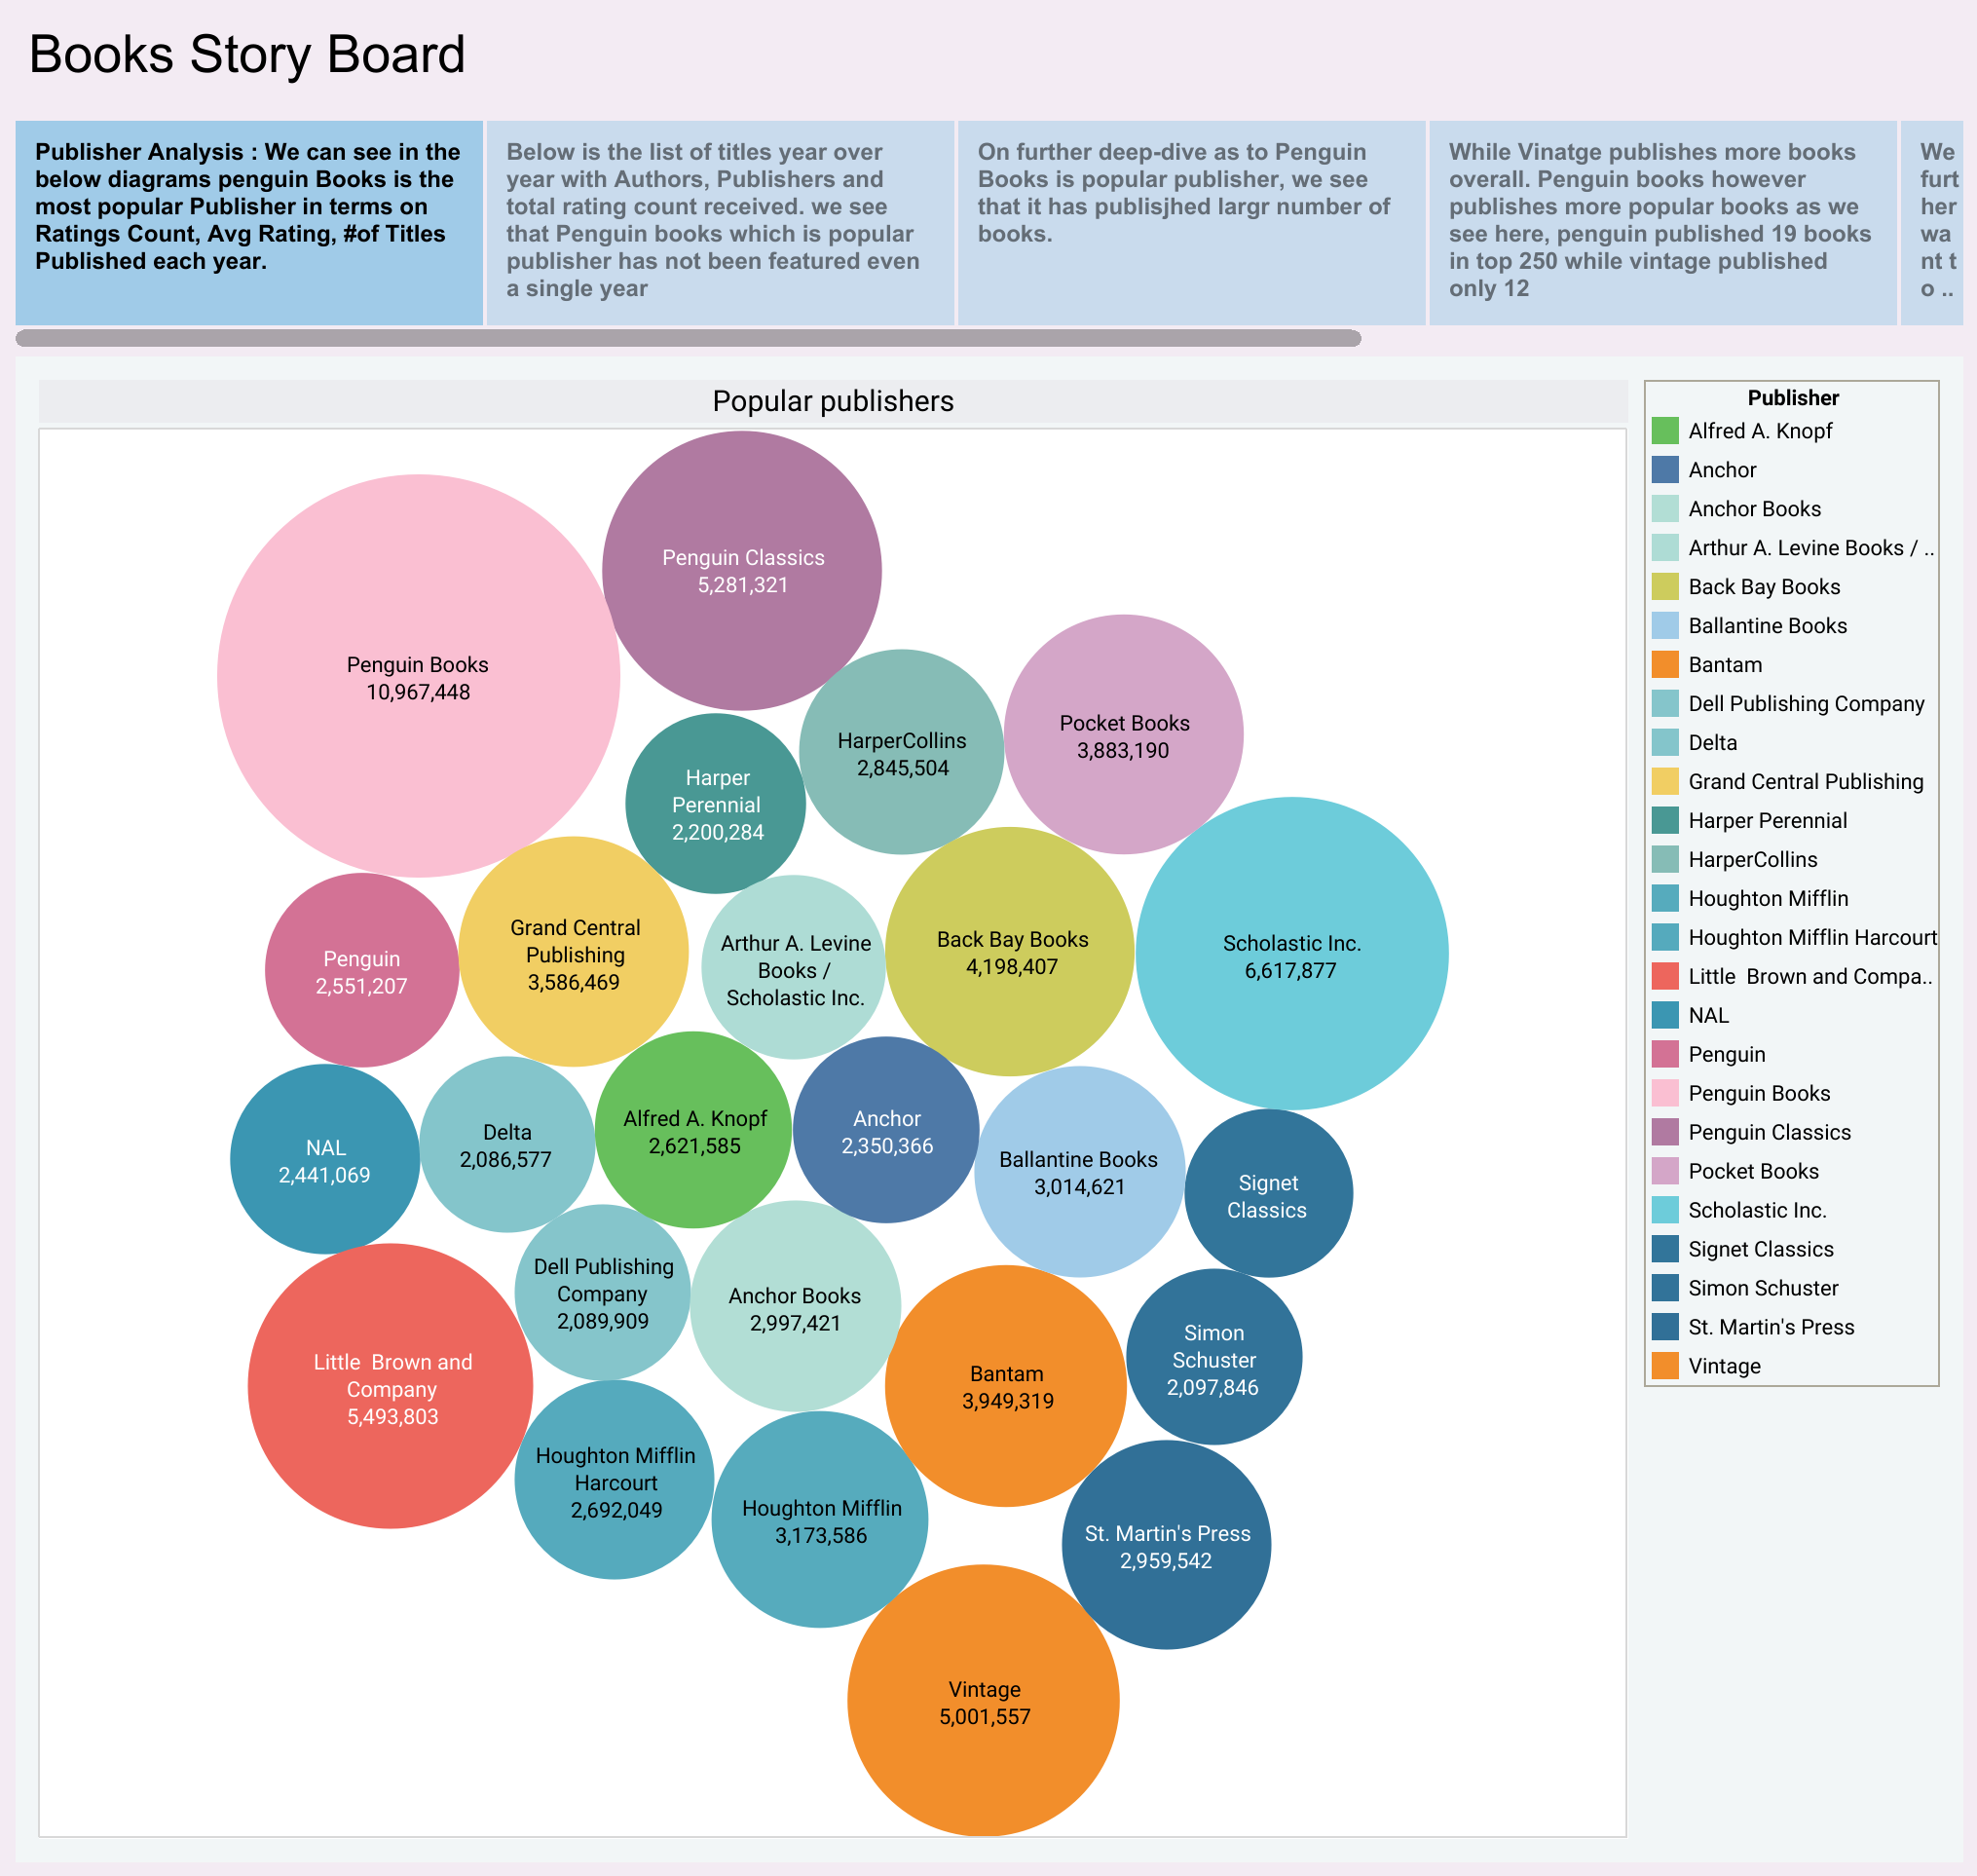
I found this Goodreads data on Kaggle and being a book enthusiast myself, I wanted to analyze this data assuming as a bookstore owner who has to decide which publications are to be sold. This story board explains few aspects of the growth of publications over the years, further deep dive on the famous publications, authors and their books.